The U.S. Budget: From Surplus to Deficit and Back?
March 05, 2011 | Carl Smith
Back to Articles | Previous Page
Related Finance Topics | Economics | Financial History | Public Finance
Debt and deficits have become major issues in the post-financial-crisis world. National, state and local government budgets across the globe are under deep stress and their credit is deteriorating. In the United States, though, there was a federal budget surplus only a decade ago. By tracing the ballooning deficit over the past ten years, can we find a way back to a surplus?
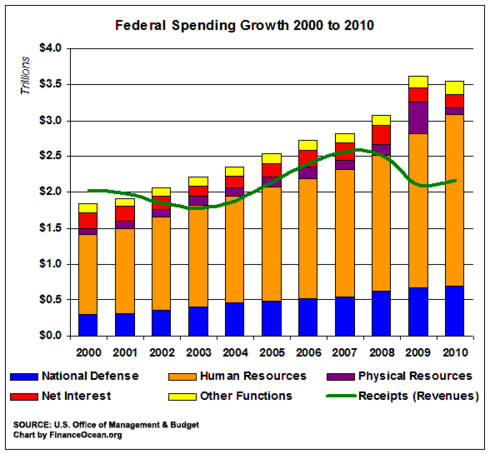
In the year 2000, the United States had a budget surplus of $236 billion. In that year, the government had receipts (revenues) of $2.02 trillion dollars (20.6% of GDP) and had outlays (expenses) of $1.79 trillion (18.2% of GDP).
By 2010, however, the United States had a budget deficit of $1.3 trillion. The government had receipts of $2.16 trillion dollars (14.9% of GDP) and had outlays (expenses) of $3.46 trillion (23.8% of GDP).
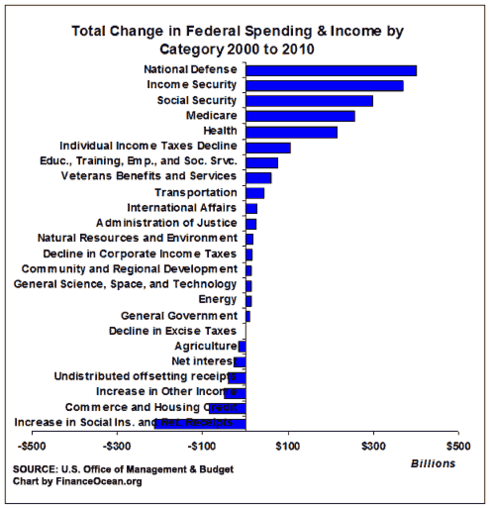
Even these headline numbers can tell us that the current deficit is the result of both a decline in the overall tax rate and an increase in spending relative to GDP. The economy grew at an annual rate of 3.98% over the decade, while spending grew at a rate of 6.81% and government receipts grew at only 0.66% annually.
Back to a Surplus
So how do we get back to a surplus? The question is a very difficult one from a political standpoint, so let’s completely side-step politics for a moment and use a simple mathematic approach. What if we simply turned back the clock to the year 2000 and set taxation and spending to the same levels that they were in that year relative to GDP?
Sure, there are new realities — both political and otherwise — that may prevent us from reaching a budget at exactly the same proportional spending levels as 2000, but it will at least give us a baseline. So how do we do it?
Taking each line item in the 2000 budget — both revenues and expenses — we simply divide them by the total GDP figure in 2000 to get their relative proportion. We can then multiply each of those figures by the OMB’s projected GDP for years out into the future to get a budget that is in line with that of the 2000 surplus.
But won’t changes in government taxation and spending affect U.S. GDP? Certainly — but the degree and direction of that effect can depend on the economic theory you use or your political leanings. Again, these projections will just be used as a baseline to get a realistic dialogue to ensue and prompt a discussion about just how drastically the budget must change.
How Soon to Surplus?
As most of these changes would be too drastic to accomplish in a single year, we must also phase in these changes over a number of years. Let’s use a period of five years to phase in these changes. That may be too quick for political reasons, but again, let just establish a baseline.
Here is how much each major line item of the 2010 budget would have to change to get back to the levels relative to GDP of 2000 (total change, then annualized over five years):
| U.S. Budget Change Over Five Years from 2010 | Total ∆ | Annual ∆ |
|---|---|---|
| Receipts (Revenues) | ||
| Individual Income Taxes | 114.04% | 16.44% |
| Corporate Income Taxes | 107.32% | 15.70% |
| Social Insurance and Retirement Receipts | 44.54% | 7.65% |
| Excise Taxes | 97.07% | 14.53% |
| Other | 24.54% | 4.49% |
| Total | 79.29% | 12.39% |
| Outlays (Expenses) | ||
| National Defense | -18.74% | -4.07% |
| Human Resources | ||
| Education, Training, Employment, and Social Services | -19.39% | -4.22% |
| Health | -19.84% | -4.33% |
| Medicare | -16.44% | -3.53% |
| Income Security | -21.92% | -4.83% |
| Social Security | 10.92% | 2.09% |
| Veterans Benefits and Services | -16.99% | -3.66% |
| Total | -10.47% | -2.19% |
| Physical resources | ||
| Energy | -112.55% | -166.02% |
| Natural Resources and Environment | 9.64% | 1.86% |
| Commerce and Housing Credit | -107.46% | -159.51% |
| Transportation | -2.46% | -0.50% |
| Community and Regional Development | -14.55% | -3.10% |
| Total | 83.21% | 12.87% |
| Net interest | 117.58% | 16.82% |
| Other functions | ||
| International Affairs | -27.08% | -6.12% |
| General Science, Space, and Technology | 14.67% | 2.78% |
| Agriculture | 226.87% | 26.73% |
| Administration of Justice | 2.12% | 0.42% |
| General Government | 8.18% | 1.59% |
| Total | 25.15% | 4.59% |
| Undistributed offsetting receipts | -0.71% | -0.14% |
| Total, Federal outlays | -0.90% | -0.18% |
| Surplus (Deficit) | -134.97% | -181.05% |
Budget Problem Areas
Clearly, these will be some tough changes to swallow. Individual income taxes would have to increase by 114% or 16.5% a year for five years to get back to the same relative levels as 2000. Corporate taxes, likewise, would need to increase by 107% or 16% a year for five years. Those are some steep political hills to climb.
Defense would need to be cut by nearly 19% or 4% a year for five years. Human resources — which includes Social Security, Medicare, education and other programs — would need to be cut by 10.5% or 2% a year for five years.
Some Budget Surplus?
Not every area is in bad shape, though. Physical Resources could actually be increased by 83% or 13% a year for five years. Physical Resource spending is well below the relative levels of 2000. Other Functions — international affairs, science, agriculture, justice and general services — could also be increased by 25% or 4.5% a year for five years. They are also below the spending levels of 2000 relative to GDP.
Interest Expenses could actually increase by 117.5% or 17% a year for five years and still be in line with the relative interest expenses of 2000. And it’s a good thing too. Since interest expense is a function of the debt level and Treasury rates (both of which are likely to increase in the next five years) it is nearly guaranteed that interest expenses will be headed higher anyway.
Where the Pain Must Start
So what does all this tell us? Well, there are only two major areas where spending needs to be cut: Defense and Human Resources. Unfortunately, these are the two largest portions of the budget and also the most politically sensitive.
All the other spending areas have actually shrunk in size relative to GDP. Perhaps they could continue along the same shrinking trajectory, or perhaps they are woefully under-funded. That’s a political decision, but obviously the focus needs to be on the other larger budget items.
Finally, tax revenues will need to pick up one way or another. Overall revenues would need to increase by 80% or 12% a year for five years — and that’s relative to GDP already. The argument that the U.S. can grow the economy to make up for lost tax revenues and continue the current rates is downright laughable.
The United States would have to grow at twelve percentage points on top of what the OMB already forecasts its growth to be. The resulting rate would be much, much faster than that of China and several times faster than our current rate of growth. And that assumes that we’re also making all the drastic spending cuts proposed above.
In short, there is plenty of pain to dish out both on the revenue and expense side of the U.S. budget.
Tough Questions
Solving the deficit debacle comes down to two simple — albeit controversial — questions: Which citizens will shoulder the necessary tax increases and which citizens will suffer the necessary benefit cuts?
The path outlined above is just a general guideline of a government budget at levels relative to GDP that were acceptable in the past (just ten years ago) and one that generates a surplus. But as they say, the devil is in the details. Who gets stuck with higher bills and who loses out on benefits are questions that must be answered by tough politicians.
For historical budget data and detailed budget projects, see the related documents box.
Back to Articles | Previous Page
This web site is intended only to convey information. It is not to be construed as an investment guide or as an offer or solicitation of an offer to buy or sell any securities. The author has taken all usual and reasonable precautions to determine that the information contained in this website has been obtained from sources believed to be reliable.